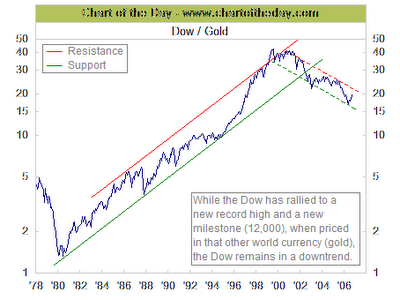
dow vs. inflation and gold / no records in sight
the first one is the chart that looks very impressive and is always shown in the media and from wall street to suggest that stocks are at new records. the fact that nominal records must be put in perspektive (here gold plus inflation). this is even more importend when you come from outside the us and have to factor in currency swings..... this year the nominal dow gain from around 13% translates only in a 6% gain for a european investor/chart dow vs euro http://tinyurl.com/yh74te. subtract the inflation and......
auf den ersten blick wirken die in den medien gezeigten charts des dow und co immer sehr eindrucksvoll und suggerieren das aktien in der tat auf neuen rekorshöhen sind. das ganze ergibt allerdings erst dann einen sinn wenn man sich von den nominellen rekorden nicht blenden läßt und das ganze im relation zu inflation und indiesem falle gold ansieht. von rekorden da weit und breit keine spur.....für investoren von ausserhalb der usa sieht das ganze unter berücksichtigung der währungsschwankungen (zuletzt ja nur in eine richtung.... ) noch weniger lukrativ aus. der diesjährige anstieg des dow von 13% ergibt unetrm strich für nen europäischen investor 6% http://tinyurl.com/yh74te. zieht davon noch die inflation ab und.....
to add on this it looks even poorer whne oyu look at the dow vs gold chart /noch weniger imponierend sieht das ganze beim vergleich zu gold aus.
update: make sure you read the comments to this great charts from brett steenbarger http://traderfeed.blogspot.com/2006/11/is-dow-in-bull-or-bear-market.html
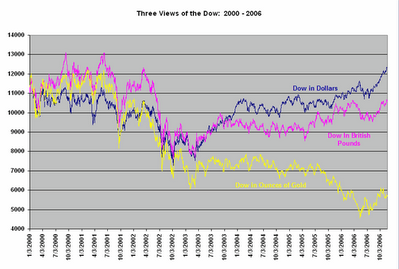
auf den ersten blick wirken die in den medien gezeigten charts des dow und co immer sehr eindrucksvoll und suggerieren das aktien in der tat auf neuen rekorshöhen sind. das ganze ergibt allerdings erst dann einen sinn wenn man sich von den nominellen rekorden nicht blenden läßt und das ganze im relation zu inflation und indiesem falle gold ansieht. von rekorden da weit und breit keine spur.....für investoren von ausserhalb der usa sieht das ganze unter berücksichtigung der währungsschwankungen (zuletzt ja nur in eine richtung.... ) noch weniger lukrativ aus. der diesjährige anstieg des dow von 13% ergibt unetrm strich für nen europäischen investor 6% http://tinyurl.com/yh74te. zieht davon noch die inflation ab und.....
größer/bigger http://tinyurl.com/yy8a84
dank geht an https://www.chartoftheday.com/
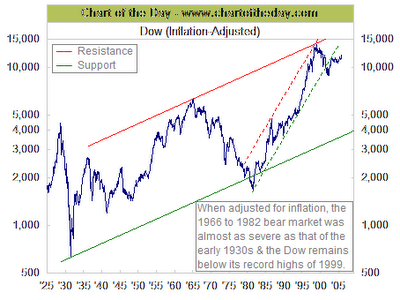
For some long-term perspective, today's chart illustrates the Dow adjusted for inflation since 1925. There are several points of interest. For one, when adjusted for inflation, the bear market that concluded in the early 1980s was almost as severe as the one that concluded in the early 1930s.
It is also interesting to note that the inflation-adjusted Dow is now a touch less than three times higher than where was in 1929 and a little over double where it was in 1965. !!!!!!!!!!
Not that spectacular of a performance considering the time frames involved. However, the magnitude of the bull market of 1982 to 1999 (even when adjusted for inflation) was truly of historic proportions. While the Dow has recently been making new record highs on a non-inflation-adjusted basis, today's chart does illustrate that on an inflation-adjusted basis the Dow still trades below its 1999 peak. Further proof that time is money.
to add on this it looks even poorer whne oyu look at the dow vs gold chart /noch weniger imponierend sieht das ganze beim vergleich zu gold aus.
update: make sure you read the comments to this great charts from brett steenbarger http://traderfeed.blogspot.com/2006/11/is-dow-in-bull-or-bear-market.html
Labels: dow vs. gold, dow vs. inflation
posted by jmf at 1:35 AM
![]()
![]()
![[Most Recent Quotes from www.kitco.com]](http://www.kitconet.com/charts/metals/gold/t24_au_en_usoz_2.gif)
![[Most Recent Quotes from www.kitco.com]](http://www.kitconet.com/charts/metals/gold/t24_au_en_euoz_2.gif)


0 Comments:
Post a Comment
<< Home