jeff saut / Roger Real Estate, Larry Leverage, Jimmy Junk bond, and the over-leveraged dance continues
what a summary!. great read and very interesting charts!/ tolle zusammenfassung und wirklich klasse charts.
dank geht an jeff saut http://www.raymondjames.com/inv_strat.htm
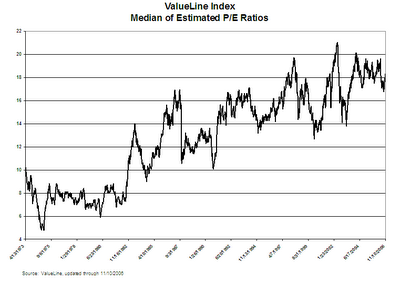
......Speaking first to valuations, we have often stated that the best representative index for the average stock is not the S&P 500, but the ValueLine Index. At its peak the median P/E ratio of the ValueLine Index was 20.9x (see chart 1).
Currently its P/E ratio is 18.3x, and while not as expensive as it was at its zenith, it is certainly not “cheap” by historic standards.
Second, as for earnings momentum, if you deduct share repurchases, and seasonally adjust earnings, one finds that earnings momentum has been slowing since 4Q05 and is currently tracking toward mid-single digits.
Third, recent reports leave little doubt that the economy is slowing. Indeed, GDP, capex shipments, ISM, private payrolls, Industrial Production, Existing Home sales, retail sales, et all, have been contracting. The lone stand-out arguing for economic strength remains governmental tax receipts, which continue to record low double-digit growth readings. Plainly that just does not “foot” with the recent 1.6% GDP report.
 größer/bigger http://www.raymondjames.com/images/inv_strat/inv_strat_061120_1lrg.gif
Other “non-footers” include:
1) a personal U.S. savings rate that appears to have bottomed, implying that Americans are saving more. This is not an unimportant observation, for it can be argued that for every 1% increase in the nation’s savings rate the business sector loses roughly $100 billion in profits;
2) reinforcing point one is a rare event that saw consumer credit actually get paid down in September with a concurrent reduction in bank lending to households during the month of October;
3) that begs the question, “following the Goldman Sachs-induced crash in gasoline prices, which have subsequently rebounded now that the gasoline weighting has been cut from 7.3% to 2.5% in Goldman’s much indexed commodity index, why have the retail stocks held up so well?!;”
4) evidently Amazon (AMZN/$42.55) and Wal-Mart (WMT/$47.50) don’t believe the retail rebound is sustainable since they are cutting their respective capex spending budgets;
5) and why, pray tell, does the U.S. Dollar Index remain amazingly resilient in light of low interest rates and given the fact that China, Russia, the United Arab Emirates, Saudi Arabia, Switzerland, New Zealand, etc. all telegraphed that they are reducing their weightings of U.S. Dollar reserves?;
6) why did the SEC, in mid-October, reduce margin requirements for select investments by hedge funds?;
7) how in the world can “guest workers” sue U.S. companies for under-paying them ( USA Today 11/15/06)?;
8) we could go on, but you get the idea . . .there are a lot of disconnects currently.
Meanwhile, participants have continued to increase their “risk profile,” as seen in the nearby chart from Merrill Lynch (chart 2), with an attendant parabolic rise in the D-J Industrial Average (DJIA). We have seen such parabolic rises before, most recently in gold’s upside blow-off between March and May of this year (we were sellers of gold back then), and historically such moves have tended to end badly. Verily, since the July “lows” the DJIA has truly gone parabolic. Interestingly, of the Dow’s 1500-point gain over those 87 sessions, roughly 1300 points have come during only 12 sessions where the often mentioned “mysterious buyers” showed up in the futures markets. This unnatural sequence has left the DJIA residing at nearly an unprecedented 1000 points above its 200-day moving average (@ 11341 DMA) and well over-bought relative to its MACD and Relative Strength Indicators (RSI)......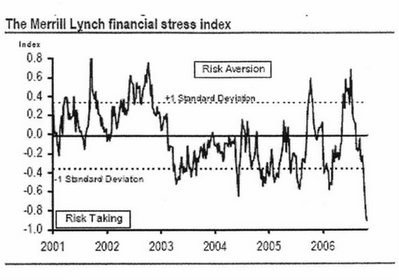 größer/bigger http://www.raymondjames.com/images/inv_strat/inv_strat_061120_2lrg.gif
The call for this week: We were aggressively bullish at the mid-June trading lows, and currently we are aggressively cautious. While that stance has cost us relative performance points recently, we continue to believe that you should not put in your “Rent-a-Kid” application right here because we think we are well past the hiring stage in this bull phase. Indeed, some of the “kids” are well on their way to going broke, like Armand Amaranth, Roger Real Estate, Larry Leverage, Jimmy Junk bond, and the over-leveraged dance continues. Our ideal trading pattern calls for a trading “top” during this holiday week, leading to a correction into the second week of December, which would set up the fabled year-end rally. Whether this plays or not only time will tell, but we have learned the hard way it is difficult to break the markets “down” during the latter half of December. However, when the markets do break down in December it can be significant . . . hello 2002, which saw the DJIA fall from its December high of 9000 into its March 2003 low of 7400.
dank geht an jeff saut http://www.raymondjames.com/inv_strat.htm
......Speaking first to valuations, we have often stated that the best representative index for the average stock is not the S&P 500, but the ValueLine Index. At its peak the median P/E ratio of the ValueLine Index was 20.9x (see chart 1).
Currently its P/E ratio is 18.3x, and while not as expensive as it was at its zenith, it is certainly not “cheap” by historic standards.
Second, as for earnings momentum, if you deduct share repurchases, and seasonally adjust earnings, one finds that earnings momentum has been slowing since 4Q05 and is currently tracking toward mid-single digits.
Third, recent reports leave little doubt that the economy is slowing. Indeed, GDP, capex shipments, ISM, private payrolls, Industrial Production, Existing Home sales, retail sales, et all, have been contracting. The lone stand-out arguing for economic strength remains governmental tax receipts, which continue to record low double-digit growth readings. Plainly that just does not “foot” with the recent 1.6% GDP report.
größer/bigger http://www.raymondjames.com/images/inv_strat/inv_strat_061120_1lrg.gifOther “non-footers” include:
1) a personal U.S. savings rate that appears to have bottomed, implying that Americans are saving more. This is not an unimportant observation, for it can be argued that for every 1% increase in the nation’s savings rate the business sector loses roughly $100 billion in profits;
2) reinforcing point one is a rare event that saw consumer credit actually get paid down in September with a concurrent reduction in bank lending to households during the month of October;
3) that begs the question, “following the Goldman Sachs-induced crash in gasoline prices, which have subsequently rebounded now that the gasoline weighting has been cut from 7.3% to 2.5% in Goldman’s much indexed commodity index, why have the retail stocks held up so well?!;”
4) evidently Amazon (AMZN/$42.55) and Wal-Mart (WMT/$47.50) don’t believe the retail rebound is sustainable since they are cutting their respective capex spending budgets;
5) and why, pray tell, does the U.S. Dollar Index remain amazingly resilient in light of low interest rates and given the fact that China, Russia, the United Arab Emirates, Saudi Arabia, Switzerland, New Zealand, etc. all telegraphed that they are reducing their weightings of U.S. Dollar reserves?;
6) why did the SEC, in mid-October, reduce margin requirements for select investments by hedge funds?;
7) how in the world can “guest workers” sue U.S. companies for under-paying them ( USA Today 11/15/06)?;
8) we could go on, but you get the idea . . .there are a lot of disconnects currently.
Meanwhile, participants have continued to increase their “risk profile,” as seen in the nearby chart from Merrill Lynch (chart 2), with an attendant parabolic rise in the D-J Industrial Average (DJIA). We have seen such parabolic rises before, most recently in gold’s upside blow-off between March and May of this year (we were sellers of gold back then), and historically such moves have tended to end badly. Verily, since the July “lows” the DJIA has truly gone parabolic. Interestingly, of the Dow’s 1500-point gain over those 87 sessions, roughly 1300 points have come during only 12 sessions where the often mentioned “mysterious buyers” showed up in the futures markets. This unnatural sequence has left the DJIA residing at nearly an unprecedented 1000 points above its 200-day moving average (@ 11341 DMA) and well over-bought relative to its MACD and Relative Strength Indicators (RSI)......
größer/bigger http://www.raymondjames.com/images/inv_strat/inv_strat_061120_2lrg.gifThe call for this week: We were aggressively bullish at the mid-June trading lows, and currently we are aggressively cautious. While that stance has cost us relative performance points recently, we continue to believe that you should not put in your “Rent-a-Kid” application right here because we think we are well past the hiring stage in this bull phase. Indeed, some of the “kids” are well on their way to going broke, like Armand Amaranth, Roger Real Estate, Larry Leverage, Jimmy Junk bond, and the over-leveraged dance continues. Our ideal trading pattern calls for a trading “top” during this holiday week, leading to a correction into the second week of December, which would set up the fabled year-end rally. Whether this plays or not only time will tell, but we have learned the hard way it is difficult to break the markets “down” during the latter half of December. However, when the markets do break down in December it can be significant . . . hello 2002, which saw the DJIA fall from its December high of 9000 into its March 2003 low of 7400.
Consequently, we find ourselves left with a George Soros quote from the year 2000 – “Maybe I don’t understand the market, but I prefer not to have the same kind of continued exposure I’ve had up until now. In some ways I think the music has stopped only most people are still dancing.” (what a great quote!)
Labels: pe, risk aversion, risk taking, saut, valueline
posted by jmf at 8:26 PM
![]()
![]()
![[Most Recent Quotes from www.kitco.com]](http://www.kitconet.com/charts/metals/gold/t24_au_en_usoz_2.gif)
![[Most Recent Quotes from www.kitco.com]](http://www.kitconet.com/charts/metals/gold/t24_au_en_euoz_2.gif)


0 Comments:
Post a Comment
<< Home